Home / Press
Press and data · River Cruise Escapes own data, 2026
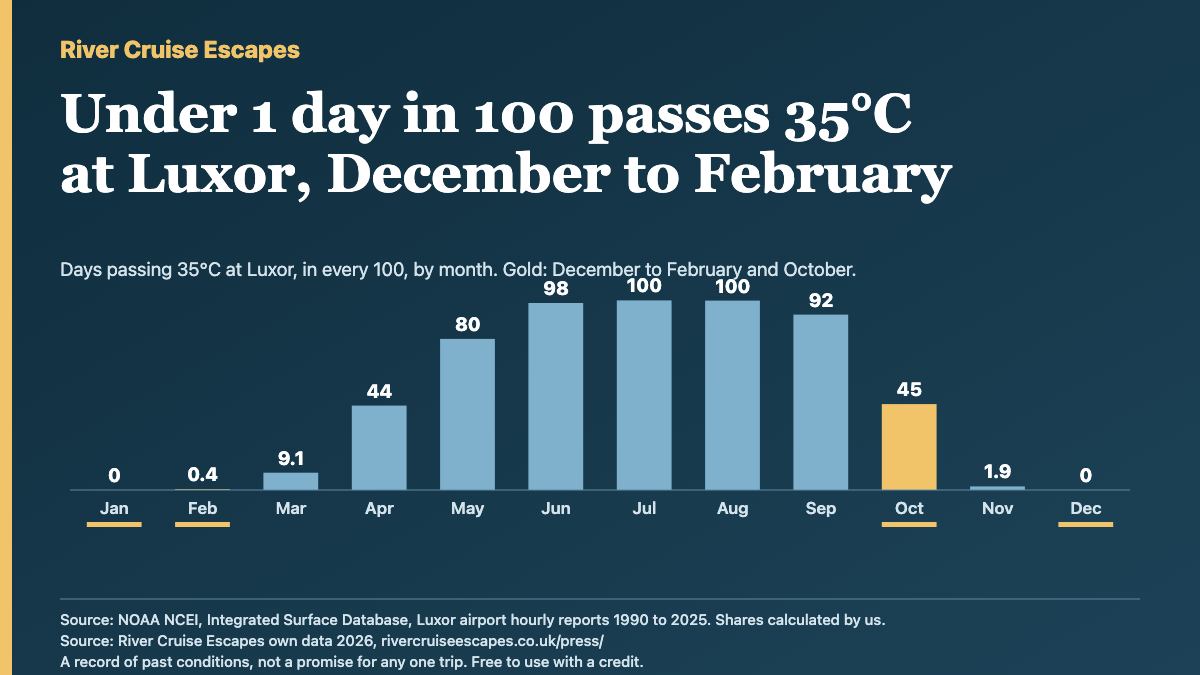
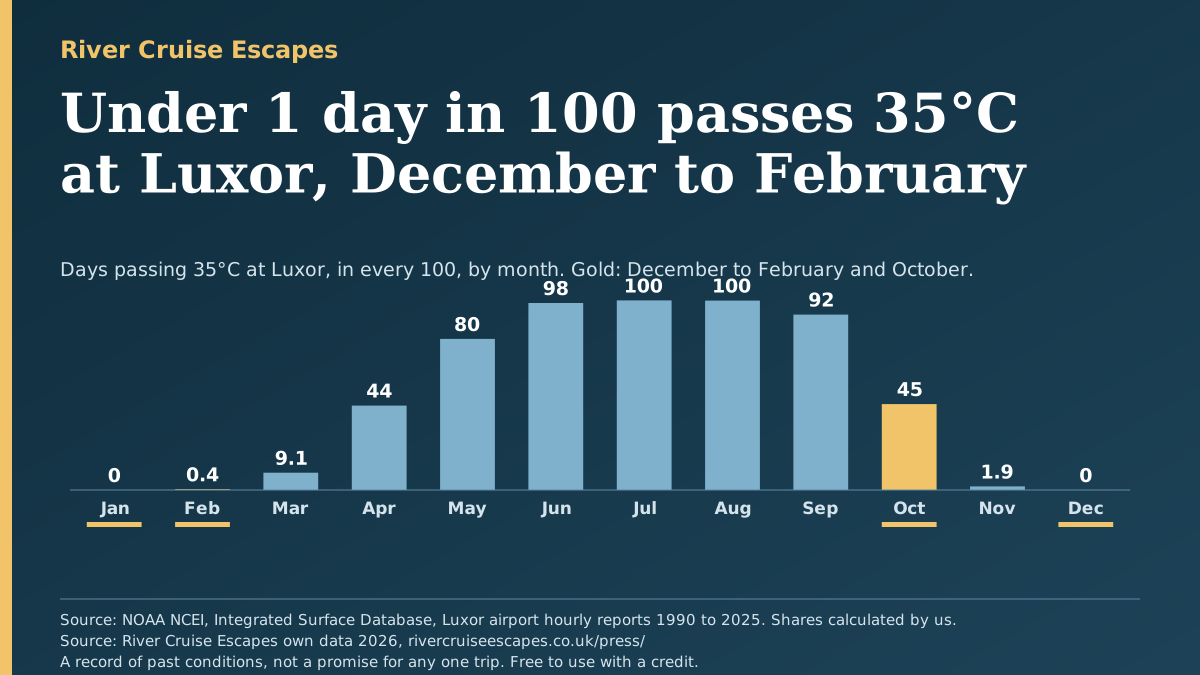
Nile cruise heat, 35 years of daily records: December to February, under 1 day in 100 passes 35°C at Luxor. In October, 45 days in 100 do.
Luxor, 1990 to 2025: shares of past days, counted from the airport's hourly weather reports, not a forecast. A record of past conditions, not a promise for any one trip. Free to quote and republish with a credit and a link to River Cruise Escapes.
Data, charts and imagesChecked October 2026
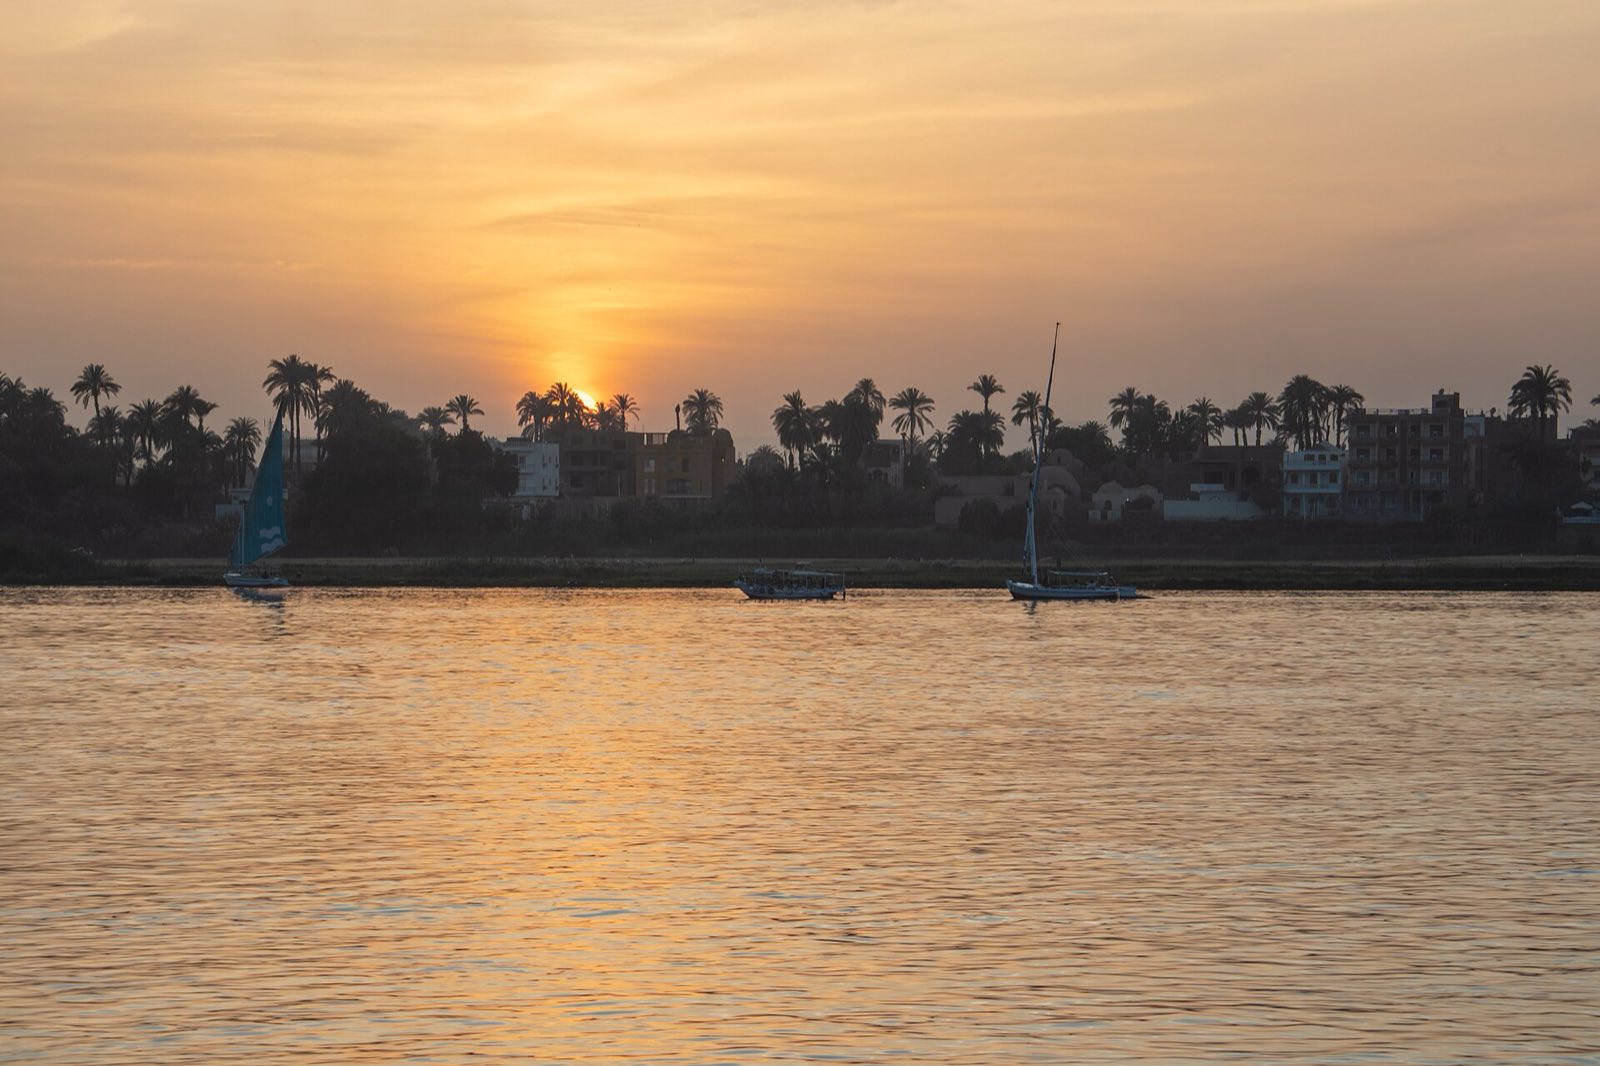
Photo: The Nile at Luxor by Diego Delso, CC BY-SA 4.0, via Wikimedia Commons. Resized (shown cropped by this page); the resized copy is shared under the same licence.
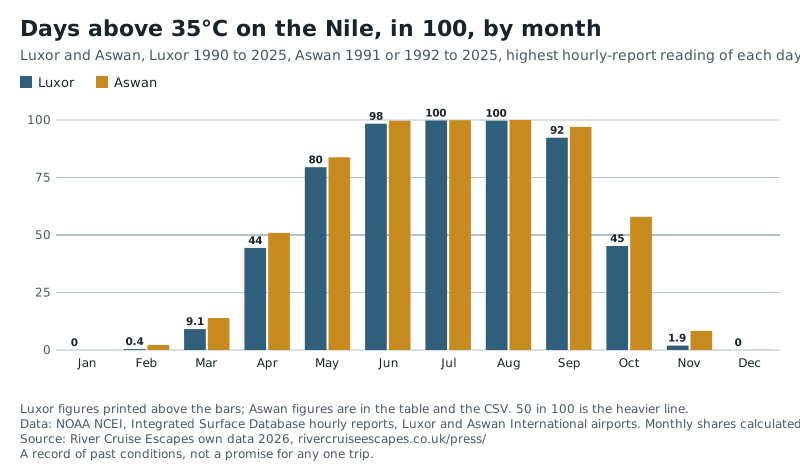
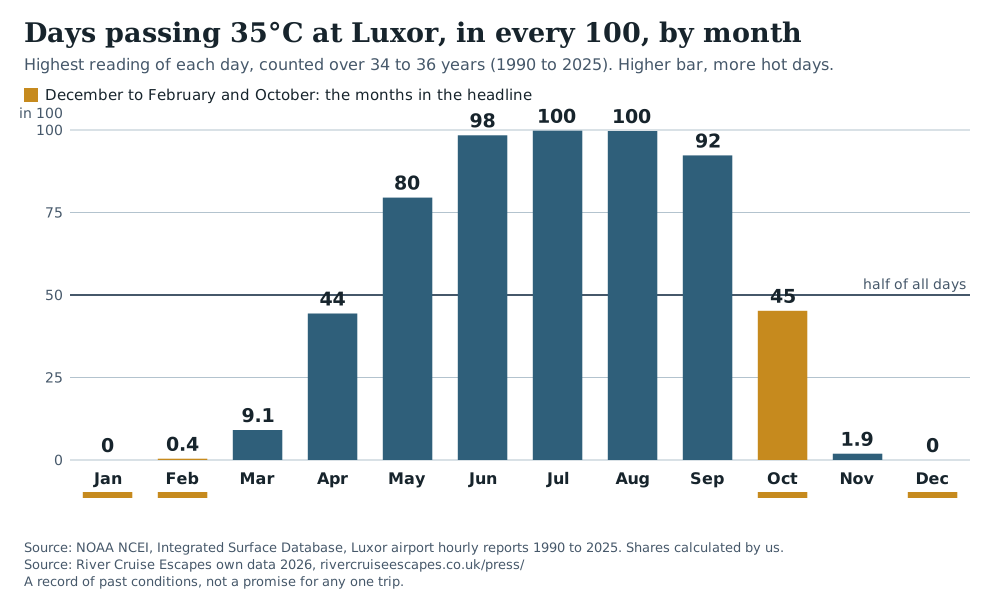
Most days from May to September pass 35°C at Luxor. Almost none do from December to February.
Each bar is a month at Luxor: the share of days whose highest reading passed 35°C.
Gold bars: December to February and October. Luxor, 34 to 36 years a month, 1990 to 2024 or 2025. A record of past conditions, not a promise for any one trip. Aswan and the method are below.
Nile heat by month
Luxor 34 to 36 years a month (1990 to 2025), Aswan 26 to 31 years a month (1991 or 1992 to 2025). Days counted are real days with enough hourly reports; none are filled in.
- December to February: under 1 day in 100 passes 35°C at Luxor (January 0, December 0, February 0.4 in 100). The average high is 22.4 to 24.4°C.
- October: 45 days in 100 pass 35°C at Luxor, with an average high of 34.9°C. At Aswan it is 58 in 100.
- Aswan runs hotter than Luxor in the shoulder months. In November 8.3 days in 100 pass 35°C at Aswan against 1.9 at Luxor. In March it is 14 against 9.1. Both are counted the same way, from each airport's hourly reports, but Aswan has fewer years (26 to 31 a month) than Luxor (34 to 36), so read the gap as a guide.
- Summer: from June to August, 98 to 100 days in 100 pass 35°C at Luxor, and 55 to 60 in 100 pass 40°C.
Nile heat by month: average high and days passing 35°C and 40°C, in 100 (past conditions)
Scroll sideways to see every column.
| Month | Luxor average high °C | Luxor over 35°C | Luxor over 40°C | Luxor years | Aswan average high °C | Aswan over 35°C | Aswan over 40°C | Aswan years |
|---|---|---|---|---|---|---|---|---|
| January | 22.4 | 0 | 0 | 36 (1990 to 2025) | 23.1 | 0 | 0 | 30 (1992 to 2025) |
| February | 24.4 | 0.4 | 0 | 34 (1990 to 2025) | 25.4 | 2.2 | 0 | 26 (1992 to 2025) |
| March | 29.1 | 9.1 | 0.5 | 35 (1990 to 2025) | 30.1 | 14 | 0.7 | 30 (1991 to 2025) |
| April | 34.6 | 44 | 10 | 36 (1990 to 2025) | 35.3 | 51 | 15 | 31 (1991 to 2025) |
| May | 38.5 | 80 | 32 | 36 (1990 to 2025) | 39.2 | 84 | 42 | 30 (1991 to 2025) |
| June | 40.7 | 98 | 55 | 35 (1990 to 2025) | 41.5 | 100 | 67 | 30 (1991 to 2025) |
| July | 40.9 | 100 | 60 | 35 (1990 to 2025) | 41.7 | 100 | 74 | 30 (1991 to 2025) |
| August | 40.7 | 100 | 56 | 35 (1990 to 2024) | 41.7 | 100 | 77 | 29 (1991 to 2024) |
| September | 38.8 | 92 | 25 | 35 (1990 to 2024) | 39.8 | 97 | 39 | 28 (1991 to 2024) |
| October | 34.9 | 45 | 3.4 | 35 (1990 to 2024) | 36.1 | 58 | 12 | 30 (1991 to 2024) |
| November | 28.8 | 1.9 | 0 | 34 (1990 to 2024) | 29.7 | 8.3 | 0 | 27 (1991 to 2024) |
| December | 23.9 | 0 | 0 | 35 (1990 to 2024) | 24.4 | 0.1 | 0 | 29 (1991 to 2024) |
"Over 35°C" means the highest reading of the day was above 35.0°C. Figures are shares of days over the years shown; the CSV has the day counts. Highlighted rows: December to February and October.
Nile heat: method and limits
- Aswan and Luxor both come from NOAA NCEI's Integrated Surface Database: the hourly weather reports from each city's airport. Luxor has no daily-maximum station in NOAA's daily archive, so Luxor's "highest reading of the day" is the highest valid hourly or three-hourly report. A day counts only with 8 or more reports, at least one of them between 11:00 and 16:59 local time, and a month in a year counts only with 25 or more counted days. The local day is taken as about UTC+2.
- Because a report is a spot reading, the highest report can sit a little below what a thermometer's true daily maximum would have shown. The shares printed here are therefore as read, and may run slightly low. They are not adjusted.
- Cross-check: NOAA's daily-maximum record for Qena, about 60 km north of Luxor, has 11 to 13 years a month, so it is indicative only. Luxor's monthly average highs sit 0.2 to 0.4°C warmer than Qena's.
- NOAA's terms ask that readings from this archive outside the US are not redistributed. We publish only our own monthly shares and averages, never the hourly readings.
- The CSV also carries Aswan's longer daily-maximum record from NOAA's daily archive (28 to 39 years a month, mostly starting in 1957 and ending between 2016 and 2025). It is a different era from Luxor's, so the table above uses the hourly-report version, which is counted the same way as Luxor's.
- A record of past conditions, not a promise for any one trip.
The total solar eclipse of 2 August 2027
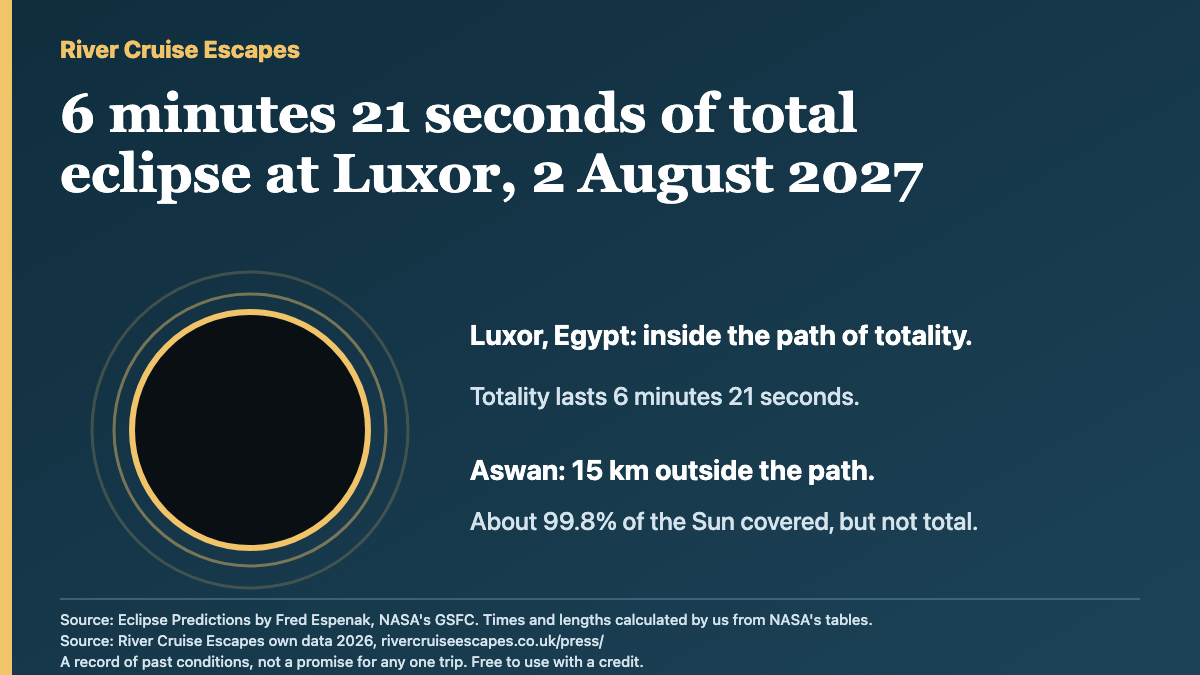
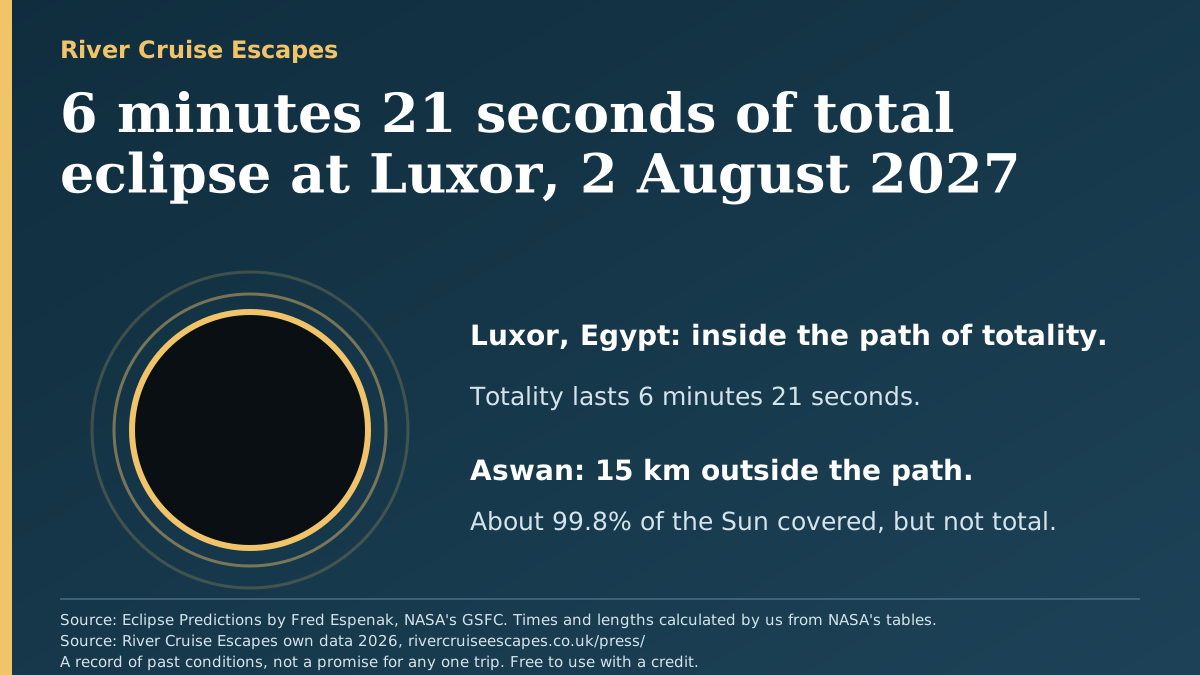
Luxor sits inside the path of totality. Aswan, upriver to the south, sits just outside it.
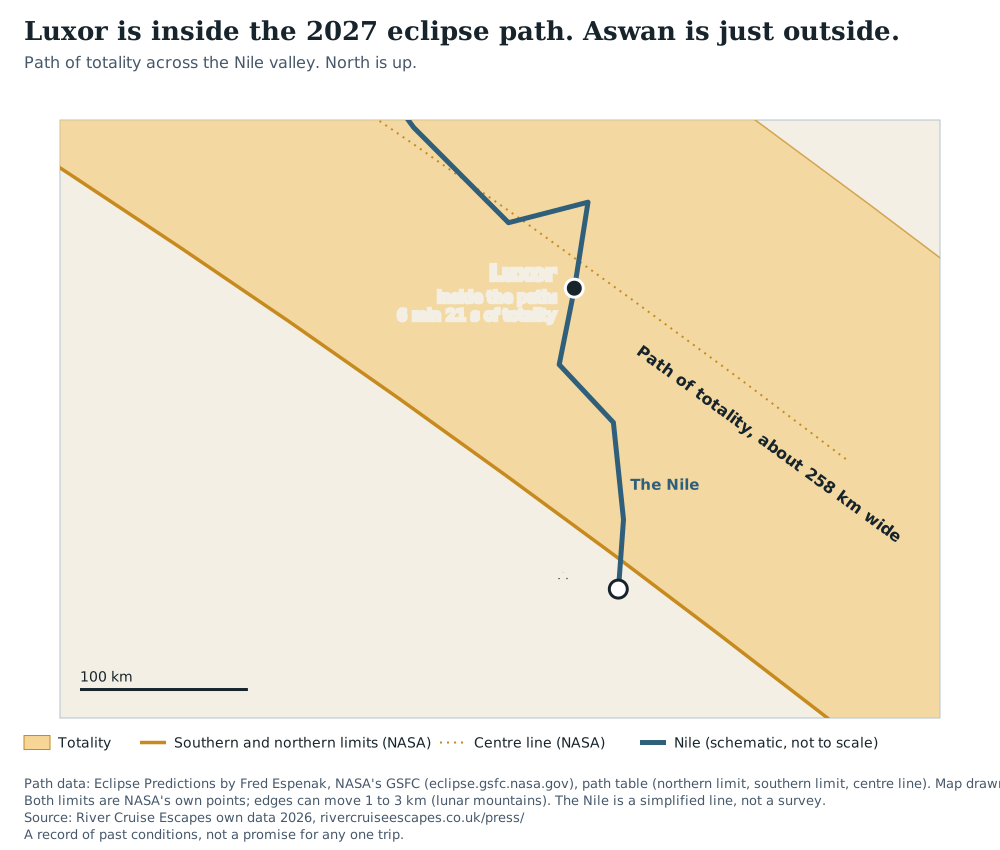
Eclipse of 2 August 2027 at Luxor and Aswan (Egypt summer time, UTC+3)
| Place | Totality begins | Totality ends | Length | Sun height | Distance |
|---|---|---|---|---|---|
| Luxor (Luxor Temple area) | 13:02:01 | 13:08:22 | 6m20.5s | 82° | 15 km from the centre line |
| Luxor International Airport | 13:02:12 | 13:08:33 | 6m21.0s | 82° | 13 km from the centre line |
| Aswan (city) | none | none | none | 83° | 15 km outside the southern limit; about 99.8% of the Sun's area covered at 13:08 |
| Aswan International Airport | none | none | none | 83° | 30 km outside; about 99.5% of the Sun's area covered |
Partial phase at Luxor Temple area: 11:40 to 14:26 (Egypt summer time, UTC+3). Percentages are of the Sun's visible area. The Sun's diameter is covered to 0.9955 at Aswan city and 0.9906 at Aswan airport.
Local times are Egypt summer time (UTC+3), which runs from 30 April to 29 October 2027. In UTC, totality at the Luxor Temple area runs from 10:02 to 10:08.
Eclipse: method and limits
- Predictions are NASA's, by Fred Espenak. We calculated place-by-place times and lengths from NASA's published Besselian elements and path table. Our method first reproduced NASA's own central-line durations to 0.1 seconds, and three separate calculation routes agree on Luxor's length to within 1 second.
- All of it rests on NASA's data. Lunar mountains move the length by 1 to 3 seconds and the edge of the path by 1 to 3 km, so a place close to the edge, as Aswan city is, should be read with that in mind.
- A record of past conditions, not a promise for any one trip.
The FCDO's Egypt advice, change by change
How often the UK government's travel advice for Egypt, issued by the Foreign, Commonwealth and Development Office (FCDO), has been updated, counted from the FCDO's own published change history. This page does not say whether Egypt is safe to visit. For the advice itself, read the FCDO page: gov.uk/foreign-travel-advice/egypt.
FCDO Egypt travel advice: dated changes in its published change history, by year
| Year | Changes listed | On how many dates |
|---|---|---|
| 2018 (from 8 Nov) | 4 | 3 |
| 2019 | 16 | 15 |
| 2020 | 54 | 53 |
| 2021 | 14 | 14 |
| 2022 | 12 | 11 |
| 2023 | 12 | 12 |
| 2024 | 9 | 8 |
| 2025 | 12 | 11 |
| 2026 (to 4 Aug) | 7 | 7 |
The history starts on 8 November 2018 because earlier changes are not listed. The advice was first published on 18 March 2013. 2018 and 2026 are part years. Read from the GOV.UK content API on 19 October 2026; the FCDO's Atom feed gives the same latest-update date.
The 8 changes to areas the FCDO advises against are dated 22 Oct 2019, 17 Mar 2022, 1 Sep 2022, 18 Oct 2022, 3 Nov 2022, 4 Apr 2023, 15 Oct 2024, 14 Jun 2025. Two nationwide Covid changes (16 March 2020 and 28 September 2021) are not counted among them, and the second, near-identical entry on 1 September 2022 is counted once. The FCDO's own note for every change is in the CSV, word for word.
FCDO timeline: method and limits
- Each change is an entry in the "change history" the FCDO publishes with the advice. Counts are of those entries. One day can carry more than one entry, which is why 140 entries fall on 134 dates.
- "Not about Covid" and "changed which areas are advised against" are our reading of the note text, done by hand on top of a keyword rule. They are approximate and labelled so. We do not sort the changes into other types, because a keyword rule is not a judgement.
- An entry in the history is a change to the advice page. We do not say what any one change meant for a traveller. The FCDO's note is quoted exactly in the CSV.
- A record of past conditions, not a promise for any one trip.
Rhine and Danube low water, by month
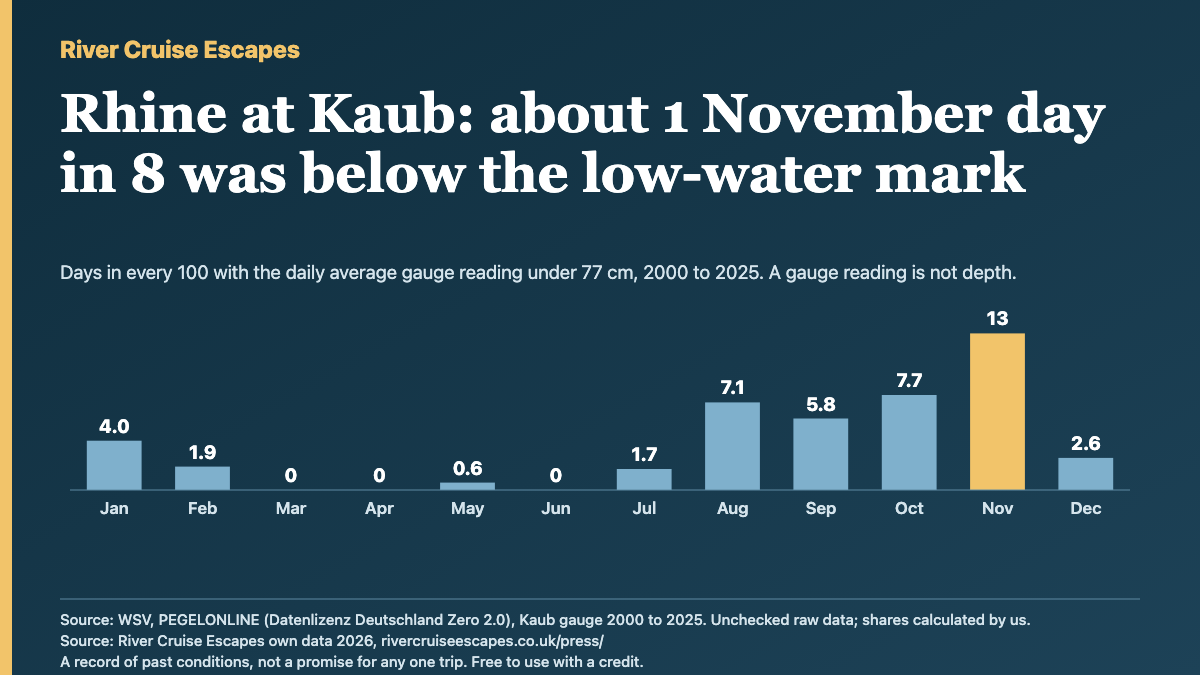
How often the river gauges sat low, counted from 26 years of readings (2000 to 2025). A gauge reading is a height on a scale at one spot, not the depth of water, and there is no official reading at which a river cruise stops. So the tables show several marks, never a single "cruise stops here" line.
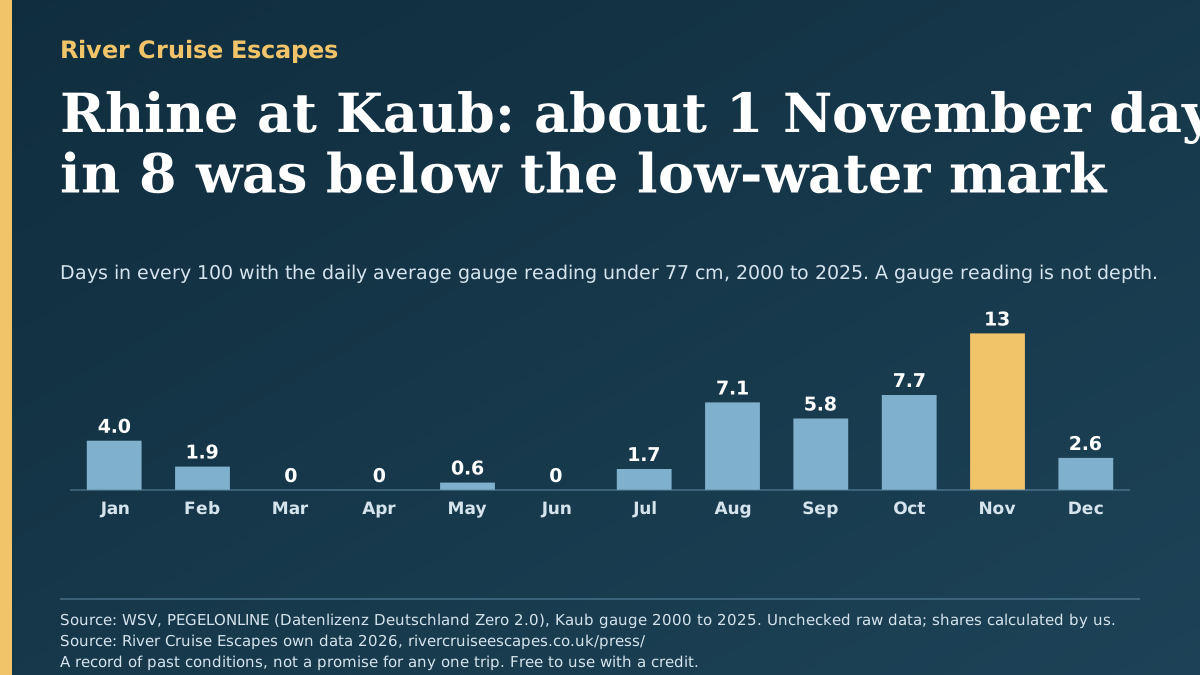
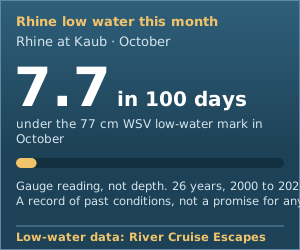
- Rhine at Kaub: about 1 day in 8 in November (13 in 100) had a daily average reading under 77 cm, the Waterways Administration's low-water mark for that gauge (its GlW, the "equivalent water level"). From March to June it is under 1 in 100. 12 of the 26 years had at least one day under it.
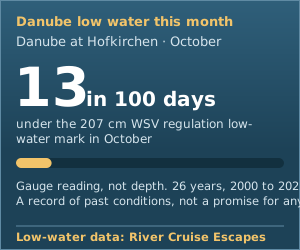
- Danube at Hofkirchen: the highest months are August to October, with 16, 16 and 13 days in 100 under 207 cm (WSV's regulation low-water level, RNW). March is 0.
- 2026 has the lowest levels on record in this data. To 18 October (291 days), Kaub's lowest daily average was -5 cm, against 25 cm in 2018, the previous lowest since 2000. Hofkirchen's was 129 cm against 155 cm in 2022. Kaub had 98 days under 77 cm in those 291 days. 2018 had 104 in the whole year, so 2018 still has the most days under 77 cm. Both are single years, not rates, and 2026 is not finished.
Rhine at Kaub, under 77 cm
Danube at Hofkirchen, under 207 cm
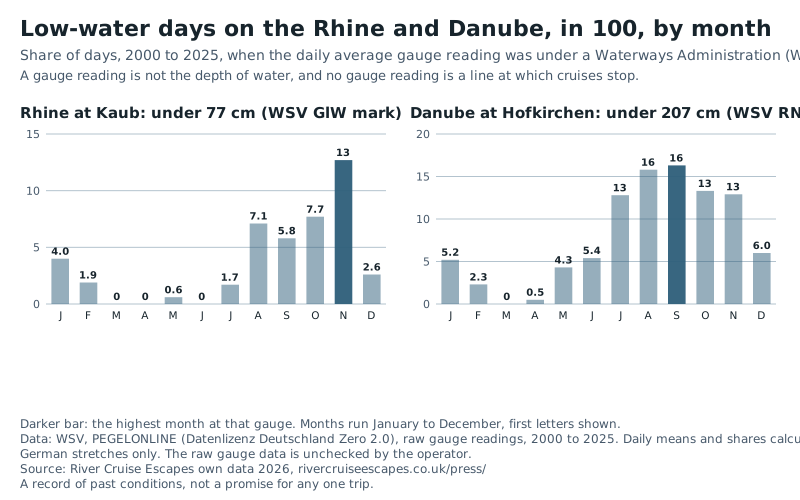
Rhine at Kaub: days with a daily average gauge reading under each level, in 100, by month, 2000 to 2025
| Month | Under 100 cm | Under 77 cm (WSV GlW) | Under 60 cm | Under 40 cm |
|---|---|---|---|---|
| January | 7.6 | 4.0 | 1.7 | 0 |
| February | 2.3 | 1.9 | 0.1 | 0 |
| March | 1.1 | 0 | 0 | 0 |
| April | 2.9 | 0 | 0 | 0 |
| May | 3.2 | 0.6 | 0 | 0 |
| June | 0.1 | 0 | 0 | 0 |
| July | 4.1 | 1.7 | 0 | 0 |
| August | 11 | 7.1 | 2.5 | 0.9 |
| September | 14 | 5.8 | 1.5 | 0.5 |
| October | 20 | 7.7 | 4.5 | 1.6 |
| November | 21 | 13 | 6.7 | 2.1 |
| December | 9.3 | 2.6 | 1.0 | 0.2 |
Danube at Hofkirchen: days with a daily average gauge reading under each level, in 100, by month, 2000 to 2025
| Month | Under 207 cm (WSV RNW) | Under 194 cm (WSV MNW) | Under 166 cm (WSV NW) |
|---|---|---|---|
| January | 5.2 | 0.2 | 0 |
| February | 2.3 | 0 | 0 |
| March | 0 | 0 | 0 |
| April | 0.5 | 0 | 0 |
| May | 4.3 | 2.1 | 0 |
| June | 5.4 | 2.8 | 0 |
| July | 13 | 4.7 | 0 |
| August | 16 | 10 | 0.9 |
| September | 16 | 8.3 | 0 |
| October | 13 | 8.1 | 0 |
| November | 13 | 5.9 | 0 |
| December | 6.0 | 0.9 | 0 |
Low water: method and limits
- Source: PEGELONLINE, the Waterways and Shipping Administration of the Federal Government (WSV): raw 15-minute gauge readings at Kaub (Rhine) and Hofkirchen (Danube), 1 January 2000 to 18 October 2026. The operator has not checked this raw data, and we say so. Values outside -50 to 1,500 cm were dropped. A day counts only with 72 or more of its 96 readings. Each day is its average reading, and the tables show the share of days under each level.
- The marks are WSV's own characteristic values for each gauge: Kaub 77 cm (GlW); Hofkirchen 207 cm (RNW, regulation low water), 194 cm (MNW, the mean of each year's lowest) and 166 cm (NW). The 60 cm and 40 cm columns at Kaub are sensitivity levels we chose and are not WSV marks. None of these is a level at which cruises stop. Navigation thresholds published elsewhere are secondary and not used.
- Rivers: the German Rhine at Kaub and the German Danube at Hofkirchen (near Passau) only. Other stretches and other countries' gauges are not covered.
- 2026 figures run to 18 October and cover 291 days. Kaub's lowest single 15-minute reading of 2026 was -6 cm on 1 October; the lowest daily average was -5 cm. Hofkirchen's lowest daily average was 129 cm, below the 155 cm daily average of 2022. Re-check these after the year ends.
- A record of past conditions, not a promise for any one trip.
Daylight by month
How many hours of daylight a day, on average, in each month at the Nile cities and at points on the Rhine and Danube. Winter days on the European rivers are short: about 8 to 9 hours in December and January, against 10.6 to 10.8 at Luxor and Aswan.
Daylight, sunrise to sunset, hours a day (monthly average over a year)
| Place | Jan | Feb | Mar | Apr | May | Jun | Jul | Aug | Sep | Oct | Nov | Dec |
|---|---|---|---|---|---|---|---|---|---|---|---|---|
| Luxor | 10.7 | 11.3 | 12.0 | 12.7 | 13.4 | 13.7 | 13.6 | 13.0 | 12.3 | 11.6 | 10.9 | 10.6 |
| Aswan | 10.8 | 11.3 | 12.0 | 12.7 | 13.3 | 13.6 | 13.5 | 13.0 | 12.3 | 11.6 | 11.0 | 10.7 |
| Rhine, Koblenz | 8.6 | 10.0 | 11.8 | 13.8 | 15.4 | 16.3 | 16.0 | 14.5 | 12.7 | 10.8 | 9.1 | 8.1 |
| Rhine, Basel | 8.9 | 10.2 | 11.9 | 13.6 | 15.1 | 15.9 | 15.6 | 14.3 | 12.6 | 10.9 | 9.4 | 8.5 |
| Danube, Passau | 8.8 | 10.1 | 11.9 | 13.6 | 15.2 | 16.1 | 15.7 | 14.4 | 12.6 | 10.9 | 9.3 | 8.4 |
| Danube, Vienna | 8.8 | 10.2 | 11.9 | 13.6 | 15.2 | 16.0 | 15.6 | 14.3 | 12.6 | 10.9 | 9.3 | 8.4 |
| Danube, Budapest | 8.9 | 10.2 | 11.9 | 13.6 | 15.1 | 15.9 | 15.6 | 14.3 | 12.6 | 10.9 | 9.4 | 8.5 |
Sunrise to sunset with the Sun's centre 0.833 degrees below the horizon, averaged over each day of a non-leap year. Calculated by us from NOAA's general solar position equations and checked against a second standard formula, which agrees within 14 minutes. These are calculated values, not observations.
Images for your story
Three ready-made images, drawn from the data on this page. Free to use with a credit: Source: River Cruise Escapes own data 2026, River Cruise Escapes, rivercruiseescapes.co.uk/press/river-cruise-data/.
PNG, 1200 × 675SVG
PNG, 1200 × 675SVG
PNG, 1200 × 675SVG
Each image carries the brand name, its source line and the caveat. Please keep them with the image.
For journalists
Data
- Nile heat by month, Luxor and Aswan (CSV)
- Eclipse of 2 August 2027 at Luxor and Aswan (CSV)
- FCDO Egypt advice: changes by year (CSV)
- FCDO Egypt advice: every change, with the FCDO's own note (CSV)
- Rhine at Kaub low water by month (CSV)
- Danube at Hofkirchen low water by month (CSV)
- Both gauges: lowest level and low-water days, year by year (CSV)
- Daylight by month (CSV)
One CSV per topic. Definitions, credits and limits: README.txt.
Charts
 Download chart: Luxor days above 35°C

Quoting this
Source: River Cruise Escapes own data 2026, River Cruise Escapes, rivercruiseescapes.co.uk/press/river-cruise-data/
Free to quote and republish with a credit and a link to River Cruise Escapes. Use the charts and CSVs as they stand; each chart prints its source line. A record of past conditions, not a promise for any one trip.
Press contact
Questions, a different cut of the data, or a comment for a story: Press Office, hello@rivercruiseescapes.co.uk
How we worked it out
Every number on this page is a count of real past days, or of real entries in an official change history, divided by the number of real days or entries. Each section above carries its own method and limits. Where a source covers fewer than 20 years of a month it is marked and left out of headlines; Qena (11 to 13 years a month) is the only such series and it is used only as a cross-check.
These are records of what has happened. They do not forecast any date, and they say nothing about the cruise you would book. A record of past conditions, not a promise for any one trip.
Data credits
- Heat: NOAA National Centers for Environmental Information (NCEI), Integrated Surface Database (hourly reports, Luxor International and Aswan International airports) and Global Historical Climatology Network Daily (Aswan station EG000062414, Qena station EGM00062403). Modified: highest daily readings selected, counted against thresholds and averaged into monthly shares. Readings outside the US are not redistributed; only our monthly shares are published.
- Eclipse: Eclipse predictions by Fred Espenak, NASA's GSFC (eclipse.gsfc.nasa.gov), Besselian elements and path table for the total solar eclipse of 2 August 2027. Modified: place-by-place times, lengths and coverage calculated by us.
- FCDO advice: Foreign, Commonwealth and Development Office, Egypt travel advice change history, GOV.UK content API, read 19 October 2026. Contains public sector information licensed under the Open Government Licence v3.0. Modified: entries counted by year and by date.
- Rivers: Wasserstraßen- und Schifffahrtsverwaltung des Bundes (WSV), PEGELONLINE, raw water-level data, Kaub and Hofkirchen. Datenlizenz Deutschland Zero 2.0 (dl-de/zero-2-0). Modified: cleaned, averaged by day and counted against WSV marks. Raw data unchecked by the operator.
- Daylight: calculated by us from NOAA's general solar position equations. No outside data.
Put this month's figure on your site
Three small cards, each showing this month's figure for one place. No script, no tracking, one visible credit link back to this page.
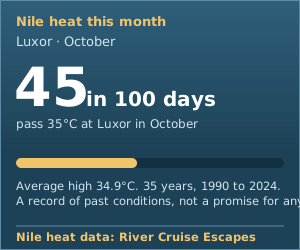
Copy this into your page (shown for Nile heat; the Rhine and Danube cards are listed below):
<iframe src="https://rivercruiseescapes.co.uk/press/river-cruise-data/widget-nile-heat.html" width="300" height="250" title="Nile heat this month" loading="lazy" style="border:0;max-width:100%"></iframe>
Fits from 260px wide up to 340px. If your site will not take an iframe, download the picture version and link it to this page. The card is rebuilt each month.
Cards for the rivers and picture versions
<iframe src="https://rivercruiseescapes.co.uk/press/river-cruise-data/widget-nile-heat.html" width="300" height="250" title="Nile heat this month" loading="lazy" style="border:0;max-width:100%"></iframe>Picture version (SVG)

<iframe src="https://rivercruiseescapes.co.uk/press/river-cruise-data/widget-rhine-low-water.html" width="300" height="250" title="Rhine low water this month" loading="lazy" style="border:0;max-width:100%"></iframe>Picture version (SVG)
<iframe src="https://rivercruiseescapes.co.uk/press/river-cruise-data/widget-danube-low-water.html" width="300" height="250" title="Danube low water this month" loading="lazy" style="border:0;max-width:100%"></iframe>Picture version (SVG)
Thinking of a cruise yourself? Tell our travel team where and roughly when, and they plan the trip with you.
Tell us about your trip